Maya Remote Debugging with Visual Studio Code
If you want to skip right to the final snippet that connects maya to a debugger, click here. Otherwise have fun reading about my debugging adventure.
# Error: AttributeError: file D:\Work\NamTools\scripts\rig_modules.py line 49: ‘NoneType’ object has no attribute ‘strip’ #
Random error message from one of your tools
What is Remote Debugging, Why is it Useful?
How many times have you seen something like the above when running a script or a tool? What are your options to figure out what went wrong?
You could:
- Change your tool settings / fiddle with the scene and run it again, hoping it will magically work this time.
- Throw a load of logging into the script, run it again and see what looks odd.
- Use a remote debugger to pause the script mid-execution.
In my day-to-day, I use a mixture of 2 and 3, after my users have used 1 several times. The logging methods are described in detail here, and provide a starting point to figure out which general piece of code is going wrong. Then, if the issue isn’t obvious from reading the code, the debugger comes out.
Remote debugging in this context means you are able to pause the execution of code, see exactly what the value of each and every variable is at each level of the callstack, and see what values function calls are returning. It’s called remote because it operates over the local network to let your IDE and Host program talk to each other.
Additionally, because python is an interpreted language, you can take advantage of the REPL to inject code between lines in your scripts. This is incredibly useful for inspecting objects, or testing the return values of functions. Something I do often when working with complicated APIs like PySide2 or Maya’s own.
Attaching a Debugger in Maya
The Visual Studio Code docs give us this code snippet to run in the environment we want to debug.
import debugpy
# 5678 is the default attach port in the VS Code debug configurations. Unless a host and port are specified, host defaults to 127.0.0.1
debugpy.listen(5678)
print("Waiting for debugger attach")
debugpy.wait_for_client()
debugpy.breakpoint()
print('break on this line')
Code language: Python (python)We have to do a couple of things before it will work in Maya specifically though.
First, Maya doesn’t know what debugpy is, so we must either install the package via Maya 2022’s new pip installer, or add it to the PYTHONPATH. For now I don’t want to also solve the issue of distributing debugpy in a deterministic way, so I’ll opt to add it to the PYTHONPATH. Your VS Code installation should have come with debugpy bundled already, so you can point it to that.
We’ll stick this at the top of the script:
import sys
import os
#os.path.expanduser("~") expands to the User's documents folder when used inside Maya, but expands to the user's root folder when run in a CPython installation.
sys.path.append(os.path.abspath(fr'{os.path.expanduser("~")}\..\.vscode\extensions\ms-python.python-2021.11.1422169775\pythonFiles\lib\python'))
import debugpy
# 5678 is the default attach port in the VS Code debug configurations. Unless a host and port are specified, host defaults to 127.0.0.1
debugpy.listen(5678)
print("Waiting for debugger attach")
debugpy.wait_for_client()
debugpy.breakpoint()
print('break on this line')
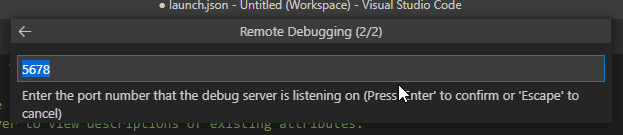
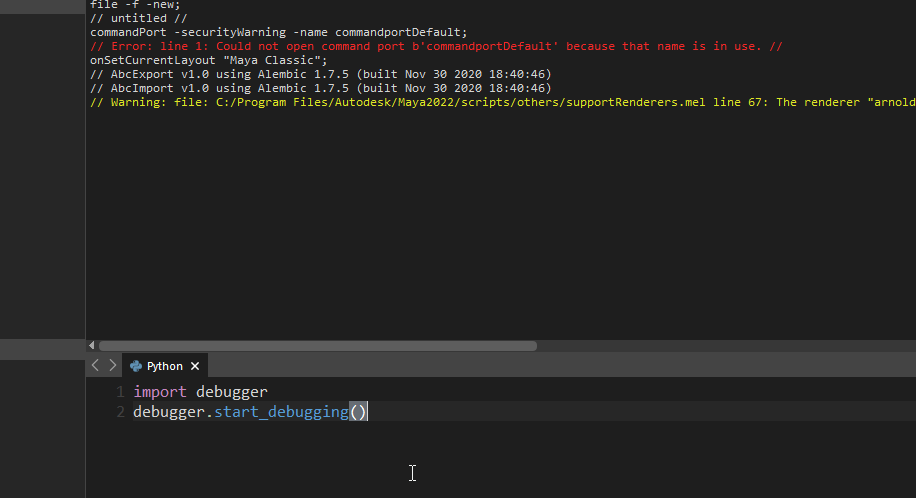
Code language: Python (python)Put all that together and run in Maya, and Maya will pause, waiting for VS Code to connect. Next, initiate the connection between the two by adding a remote attach config to your launch.json file in your VSCode workspace, and then running it.
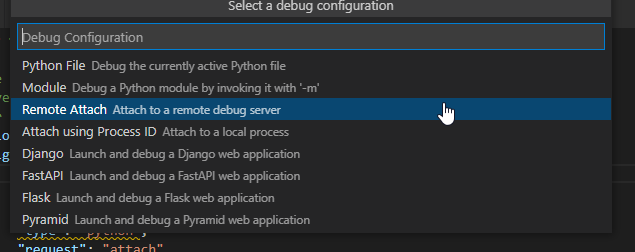
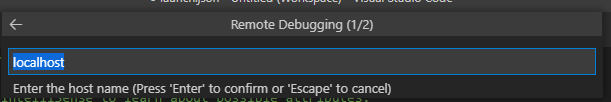
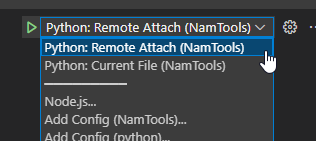
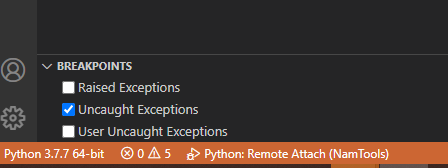
Go to your Run / Debug panel, add a config, and make sure it’s Python > Remote Attach. Ensure the server is ‘localhost’ and the port is the same as in your script. In this case 5678.
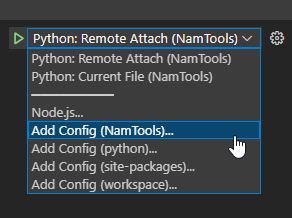
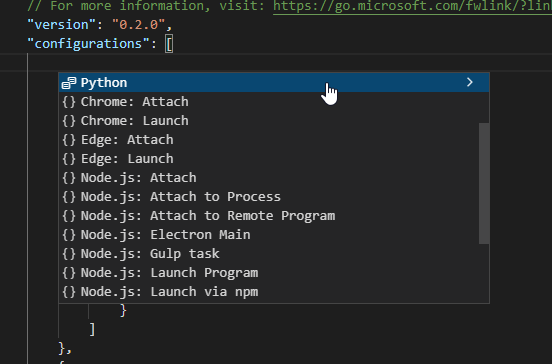
You can either do this through the UI, or manually update your launch.json file directly.
Next you want to set your “remoteRoot” key to the same as the “localRoot”, since you are most likely running the exact same files in Maya as you are editing in VSCode. In my case it’s the same root as specified in my .mod file for my tools.
{
"name": "Python: Remote Attach",
"type": "python",
"request": "attach",
"connect": {
"host": "localhost",
"port": 5678
},
"pathMappings": [
{
"localRoot": "${workspaceFolder}",
"remoteRoot": "${workspaceFolder}"
}
]
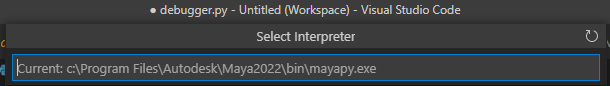
},Code language: JSON / JSON with Comments (json)Finally, ensure the interpreter you are running is the same as the one Maya is running. (I’ve had it work fine with a default 3.7 CPython interpreter, but I can’t guarantee that all versions will work. The github issues suggest at least one person having an issue where python mismatch is causing debugging to fail.)
Who Debugs the Debugger?
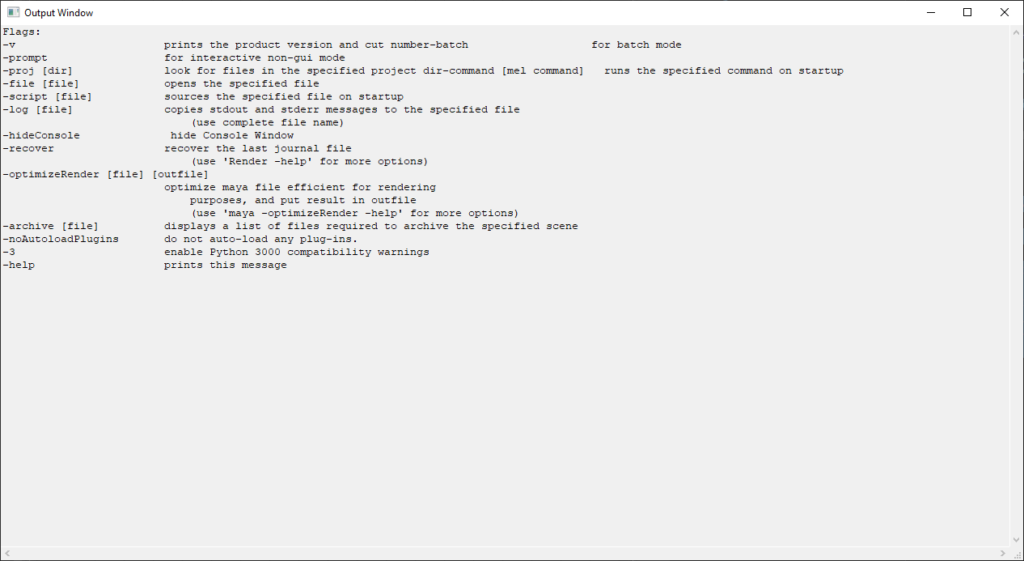
You’re all set! Run the debug config whilst Maya is still paused and…
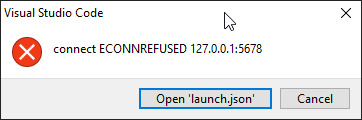
Wait what? We definitely set the right port and server, didn’t we? It won’t connect? What gives? It also opens a new output window. That’s…. odd
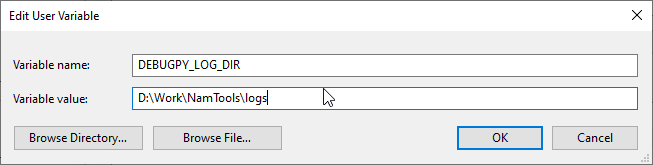
This stumped me for a good couple of hours, I was checking everything, my firewall, checking if the port was taken already, changing to different port, running and re-running the script. I had debug process no. 1 thoroughly covered. Then, tried debug process no. 2, and on the debugpy github found an environment variable that was able to log debugger output to a file: DEBUGPY_LOG_DIR, which I promptly added to my user env variables and restarted Maya.
Running the code snippet and failing to connect again showed some illuminating errors:
I+00000.015: debugpy.listen() spawning adapter: [
                 "C:\\Program Files\\Autodesk\\Maya2022\\bin\\maya.exe",
                 "C:\\Users\\Michael\\.vscode\\extensions\\ms-python.python-2021.11.1422169775\\pythonFiles\\lib\\python\\debugpy\\adapter",
                 "--for-server",
                 "53942",
                 "--host",
                 "127.0.0.1",
                 "--port",
                 "5678",
                 "--server-access-token",
                 "cf77c78f8d2713e91968c8800db7e44e98004bd6eff7c5ecba92df98c47c1273",
                 "--log-dir",
                 "D:\\Work\\NamTools\\logs"
             ]Code language: JavaScript (javascript)
Why is this targeting the maya.exe? Let’s do a Ctrl+Shift+F to find where that log string is being built. In debugpy.server.api:
adapter_args = [
            _config.get("python", sys.executable),
            os.path.dirname(adapter.__file__),
            "--for-server",
            str(endpoints_port),
            "--host",
            host,
            "--port",
            str(port),
            "--server-access-token",
            server_access_token,
        ]
        if log.log_dir is not None:
            adapter_args += ["--log-dir", log.log_dir]
        log.info("debugpy.listen() spawning adapter: {0!j}", adapter_args)Code language: Python (python)
So, it’s getting what it thinks is the python executable. Normally, this would be fine, but in maya, just like with os.path.expanduser, the output is a little different:
import sys
print(sys.executable)
>>> C:\Program Files\Autodesk\Maya2022\bin\maya.exeCode language: Python (python)
Fun, right? It doesn’t actually return the python executable mayapy.exe, instead returning the exe to maya itself. I’m sure Autodesk have their reasons, but it’s breaking our debugger! To fix it, we need the debugpy module to target mayapy.exe instead of maya.exe. Can we do that? Yes we can!
The Fix
Looking up similar issues on github show a fairly undocumented feature (seriously, you have to dig through resolved github issues) of the debugpy package whereby you can point the debug package towards a different python interpreter. This is what our final debug connection code looks like:
import sys
import os
#os.path.expanduser("~") expands to the User's documents folder when used inside Maya, but expands to the user's root folder when run in a CPython installation.
#The debugpy module may well be in a different path on your machine, so update this line.
sys.path.append(os.path.abspath(fr'{os.path.expanduser("~")}\..\.vscode\extensions\ms-python.python-2021.11.1422169775\pythonFiles\lib\python'))
import debugpy
#overwrite the default python executable
maya_location = os.path.join(os.environ.get("MAYA_LOCATION"), "bin", "mayapy.exe")
debugpy.configure({'python': maya_location})
# 5678 is the default attach port in the VS Code debug configurations. Unless a host and port are specified, host defaults to 127.0.0.1
debugpy.listen(5678)
print("Waiting for debugger attach")
debugpy.wait_for_client()
debugpy.breakpoint()
print('break on this line')
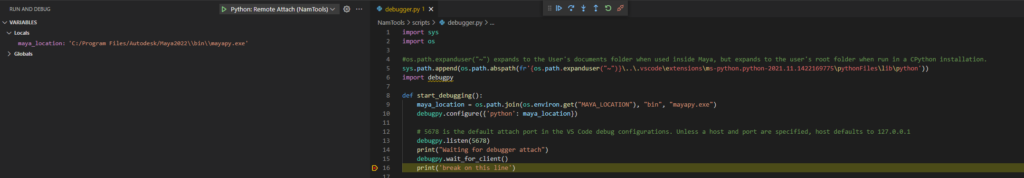
Code language: Python (python)Let’s run it and see what happens now.
Success! The breakpoint didn’t get hit though, why?
The remote debugger works by watching to see which python files are being executed, and if a breakpoint is hit in a file in VSCode’s workspace that matches the file running in the program, the program will pause.
This code has so far been run in the script editor. Specifically Chris Zubrigg’s fantastic Charcoal Editor 2. As such, there is no source file to watch.
Get around this by writing your script in a file, and just importing and invoking the code in that file through the script editor. Good thing about this is you can set your breakpoints directly in the IDE:
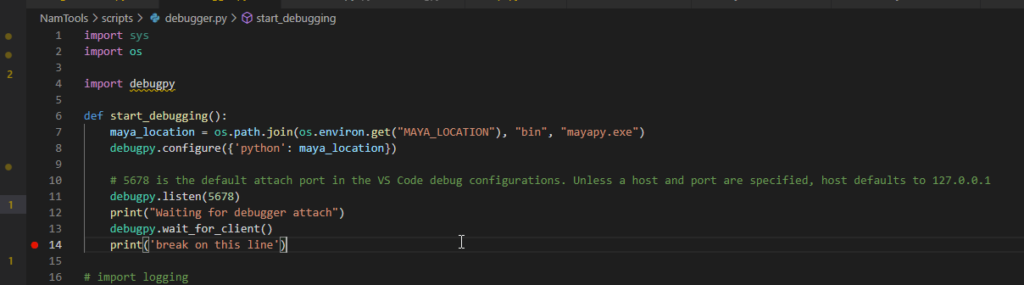
From here, you can debug to your heart’s content.
Using the Debugger Interface
For a general overview of how to actual use VS Code whilst it’s paused like this there are many video tutorials on youtube, like this one which is fairly short and to the point.
The only difference is that this guy enters debug mode by launching the file directly from VS Code, whilst we attach to a python process that’s already running.
One massively useful feature it misses out though is the usage of the Debug REPL, which lets you run code between the lines of your scripts. Luckily Microsoft themselves have you covered:
Other Options
I’ve a few other IDEs and can say that so far VS Code seems like the best option for what I do day to day, but here they are anyway since your mileage may vary.
Works fairly well, and has PyDev configured out of the box. You have to pay though, and there is a free alternative that is almost exactly the same. That being:
This requires a lot of manual setup, and getting the correct version of Java installed on your machine can be a huge pain. That said once everything is set up it works fairly smoothly. The remote debug backend code is pydev, which is also what the VS Code python debugger is built around, so it is in active development.
The IDE has some fantastic features for writing code, but for the specific use case of what a TA needs, it falls short against VS Code:
- Remote debugging is a paid option only.
- They are the most expensive paid option on this list.
- No mixed mode debugging. If you have a python tool that wraps a C++ plugin and need to debug both, you cannot debug both from the same application. People have been asking for it for almost six years, but so far no movement from JetBrains. In VS Code this is possible by launching a C++ debug configuration before / after launching the python one. It made testing PyEverything possible.
- Newer versions of PyCharm forcibly close Maya when an exception occurs. This is the dealbreaker for me. If I’m developing a tool I can’t have Maya constantly close when I misplace a parenthesis. The latest version where that doesn’t happen is 2018.3 (which I refuse to upgrade from) and that only supports up to Python 3.7. Maya 2023 might not even be debuggable at all.
Again, I reported this about two years ago, but there has been no response. - Overall, their latest updates have made it clear that Maya developers are not a target audience. Instead opting to support webdev and data science better. Case in point, it damn near took an insurrection to get a bug fixed with regards to maya.
A decent lesser-known package, paid but has a free trial. I haven’t used this a huge amount in production, but I can say it’s a python-specific IDE, so doesn’t support mixed mode debugging either.
Improvements
There are a few things that I’d like to solve with this, like making sure the path to the debugpy package won’t break with every VS Code update, or making sure the debug script accurately determines if we’re in python 3 or 2 mode, the latter of which needs mayapy2.exe to be targeted instead. Problems for another day though.
In the meantime, happy debugging! For feedback / corrections, hit me up on twitter.